Income Cohorts
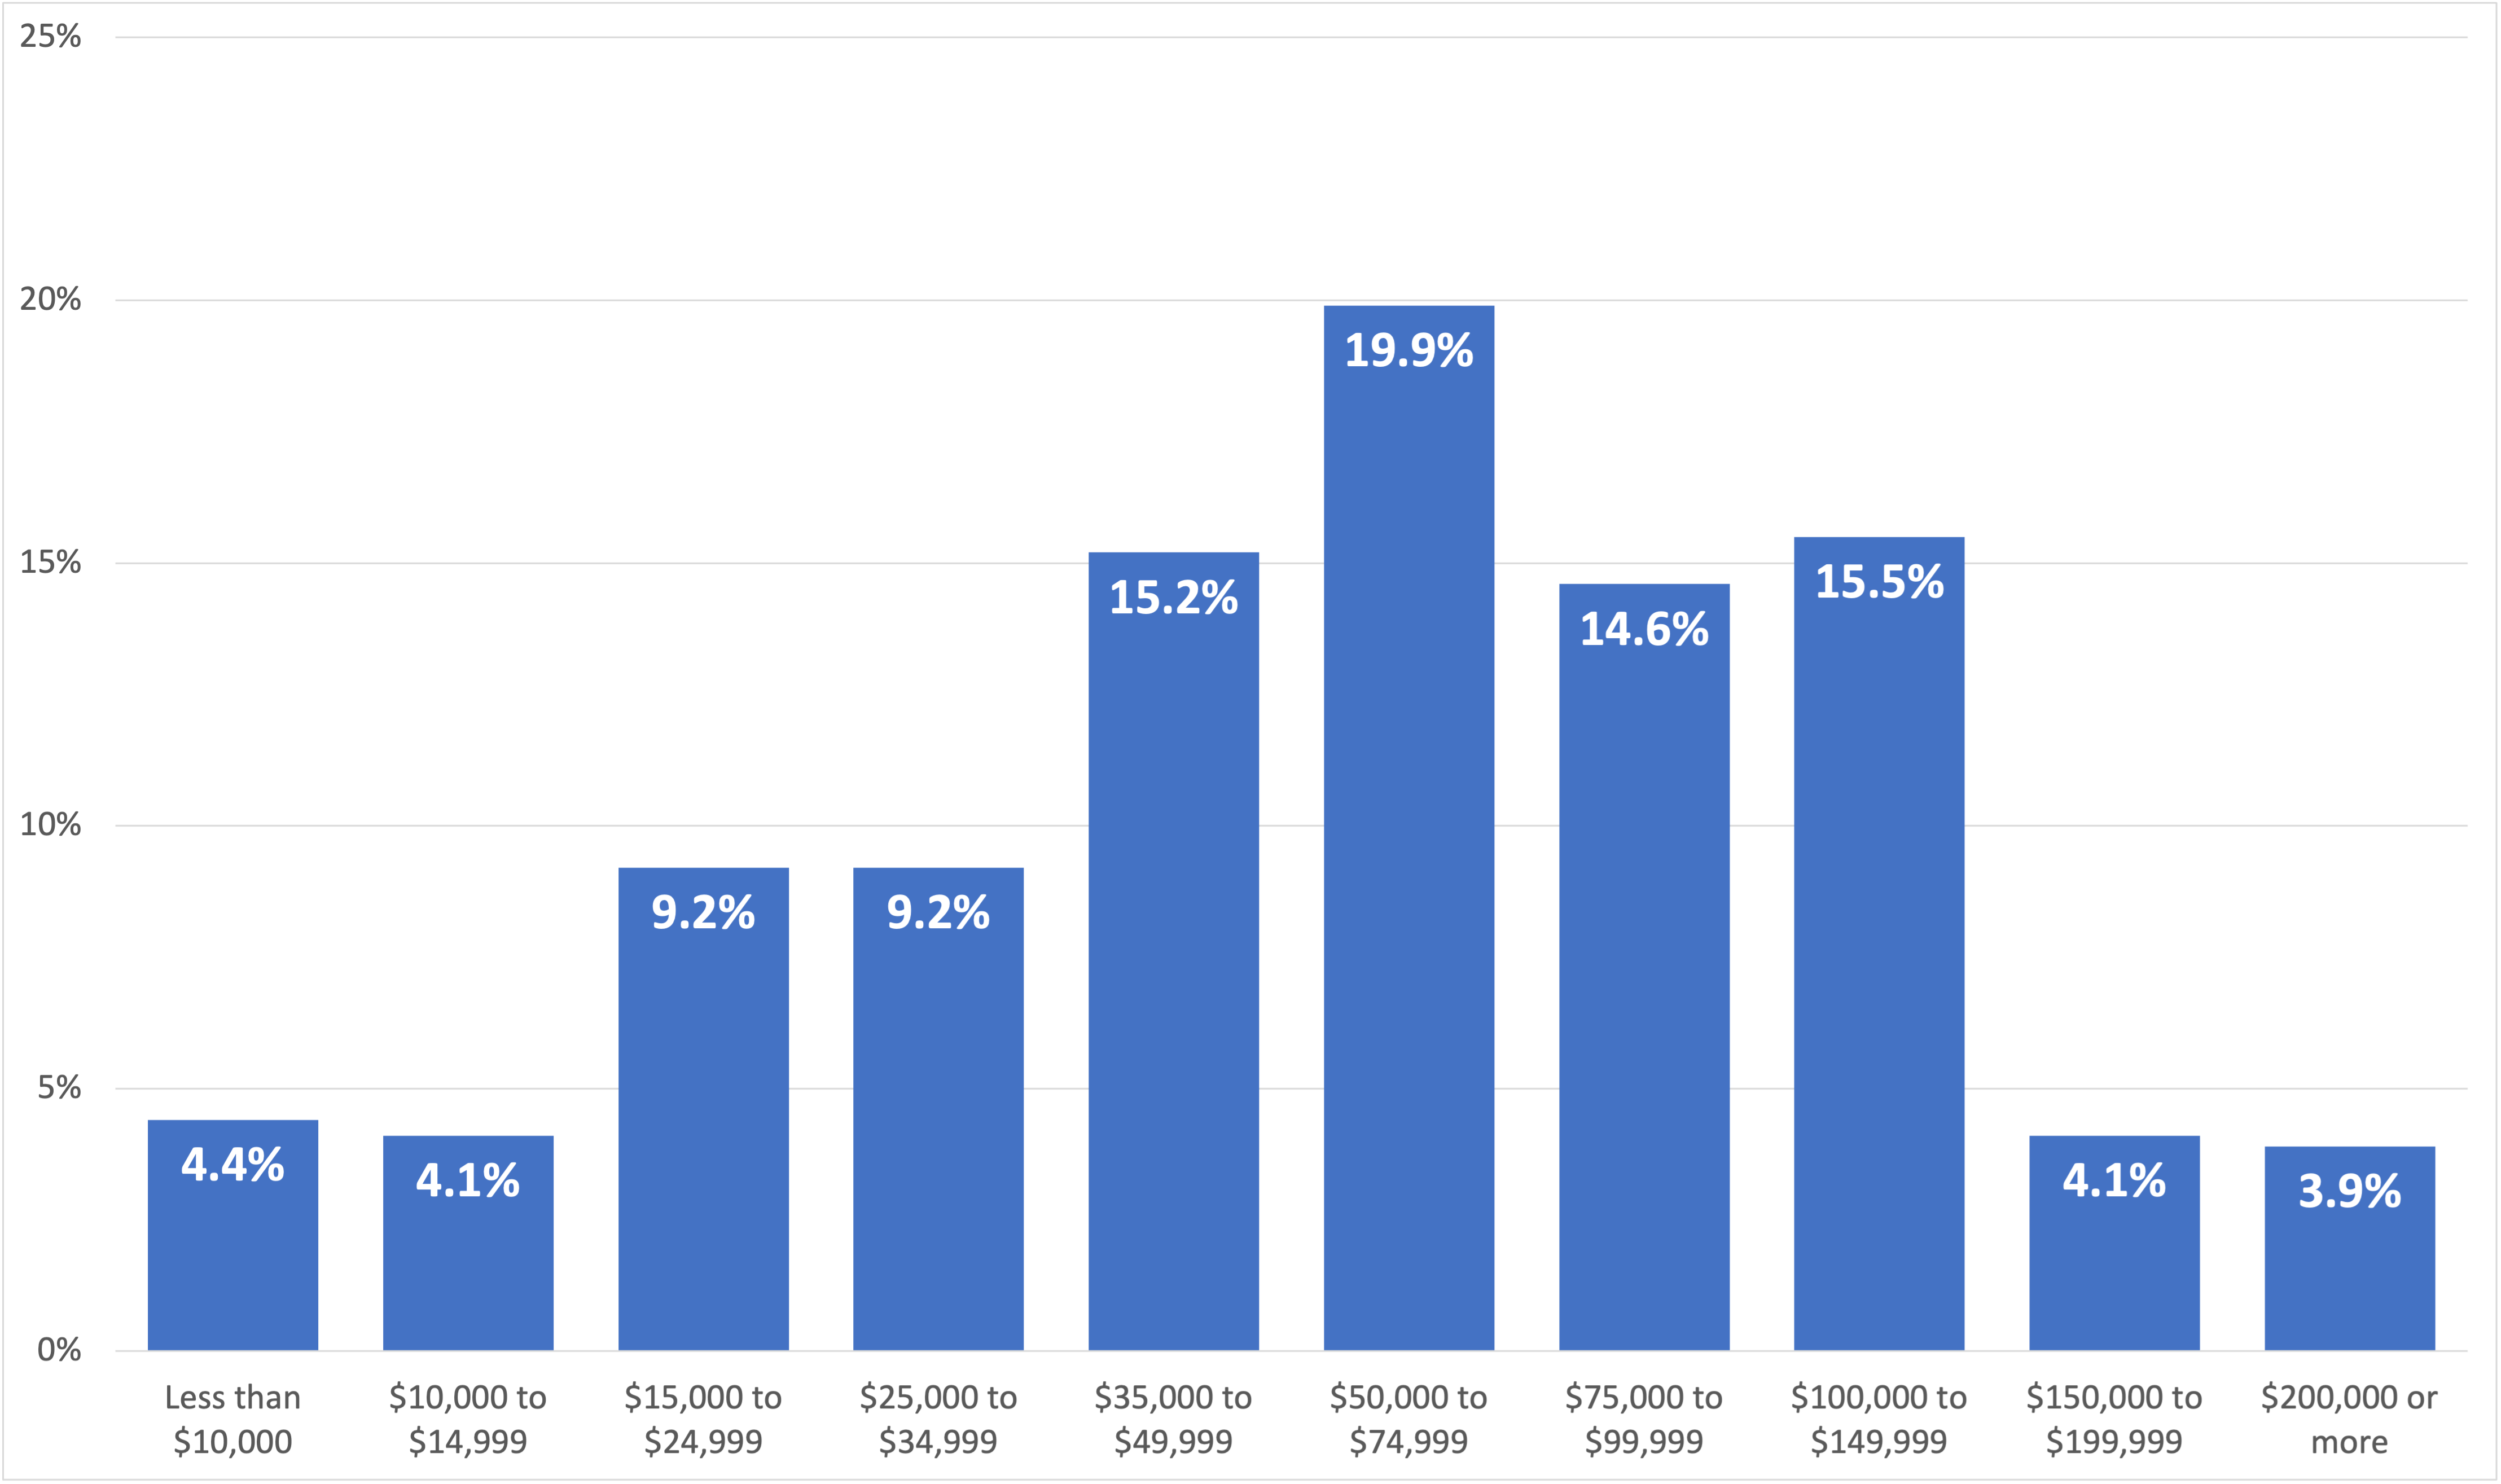
2019 5-yr American Community Survey Data, US Census Table S1901
Median Incomes
Median household income
$60,624
Owner-occupied income
$78,701
Renter-occupied income
$39,098
Median family income
$72,688
2019 5-yr American Community Survey Data
Housing Cost Burden by Income Level and Tenure
The percentage of Albany renters experiencing housing cost burden declined since 2017; however, thousands of low and extremely low-income households are paying more than 30 percent of their income on housing costs.
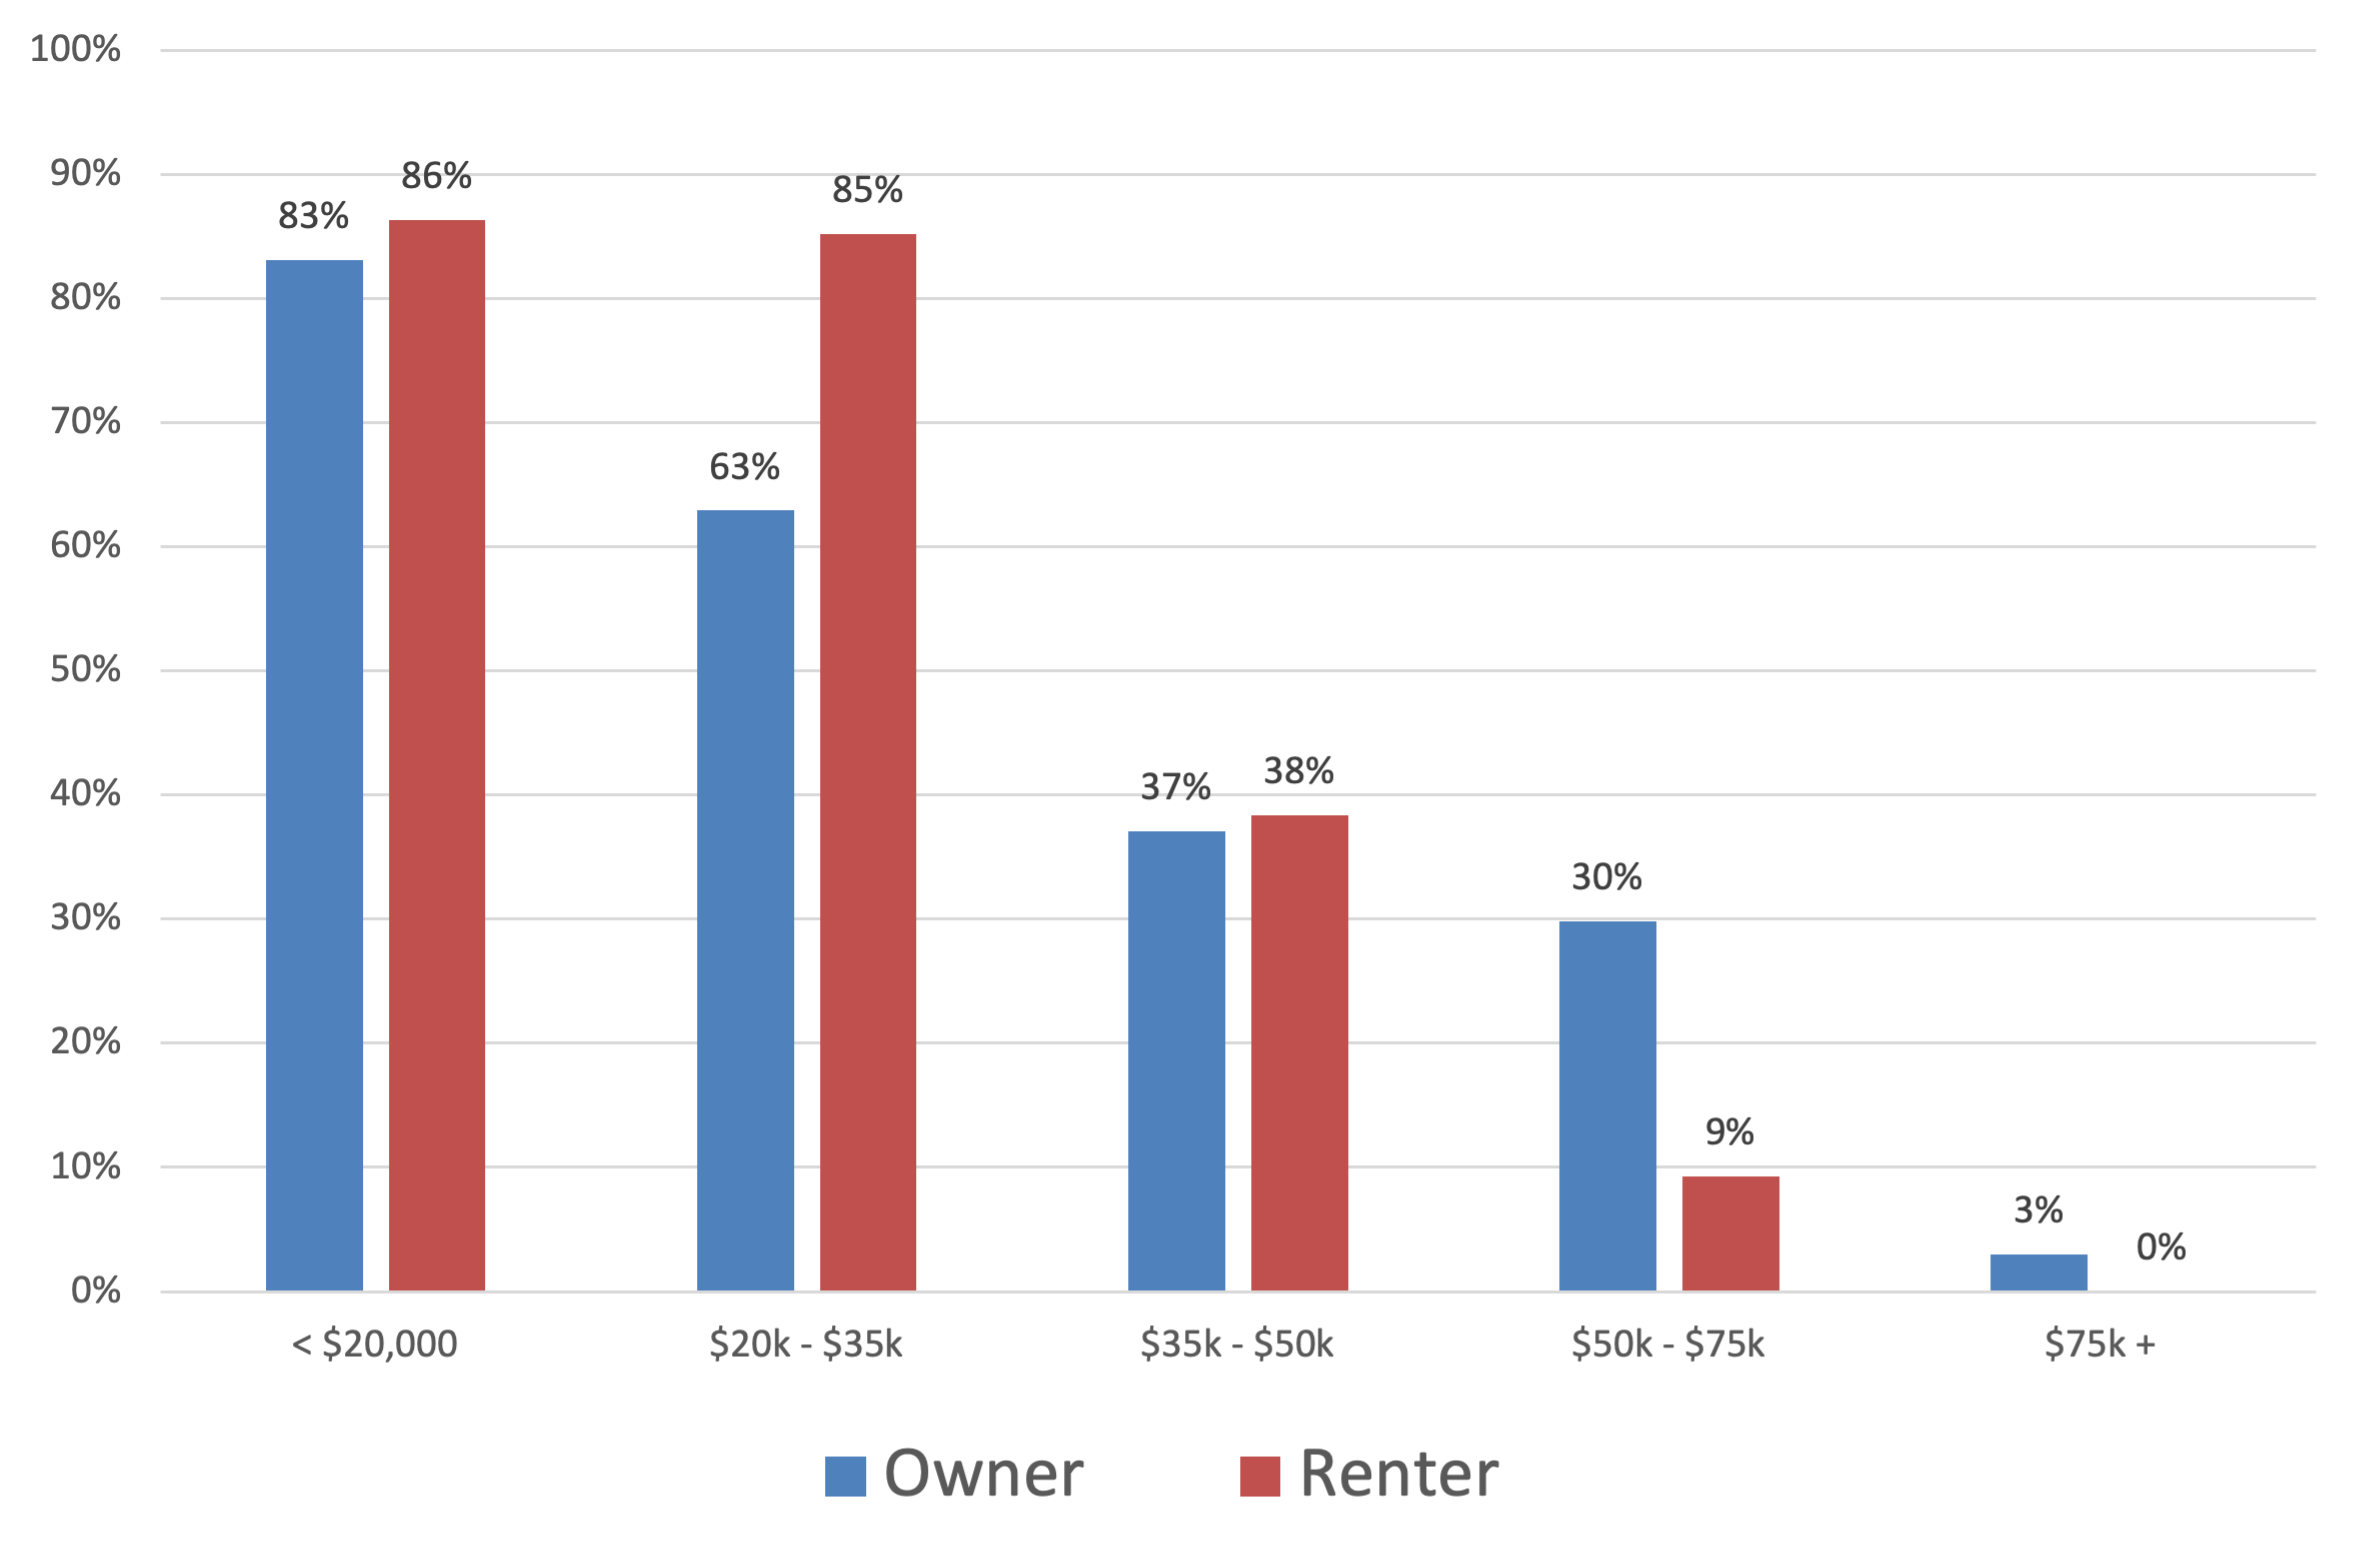
Share of Households Spending 30% or More of Income on Housing Costs, by Income Group, 2019, 5-yr American Community Survey Data, Table B25106
Poverty Status by Selected Characteristics
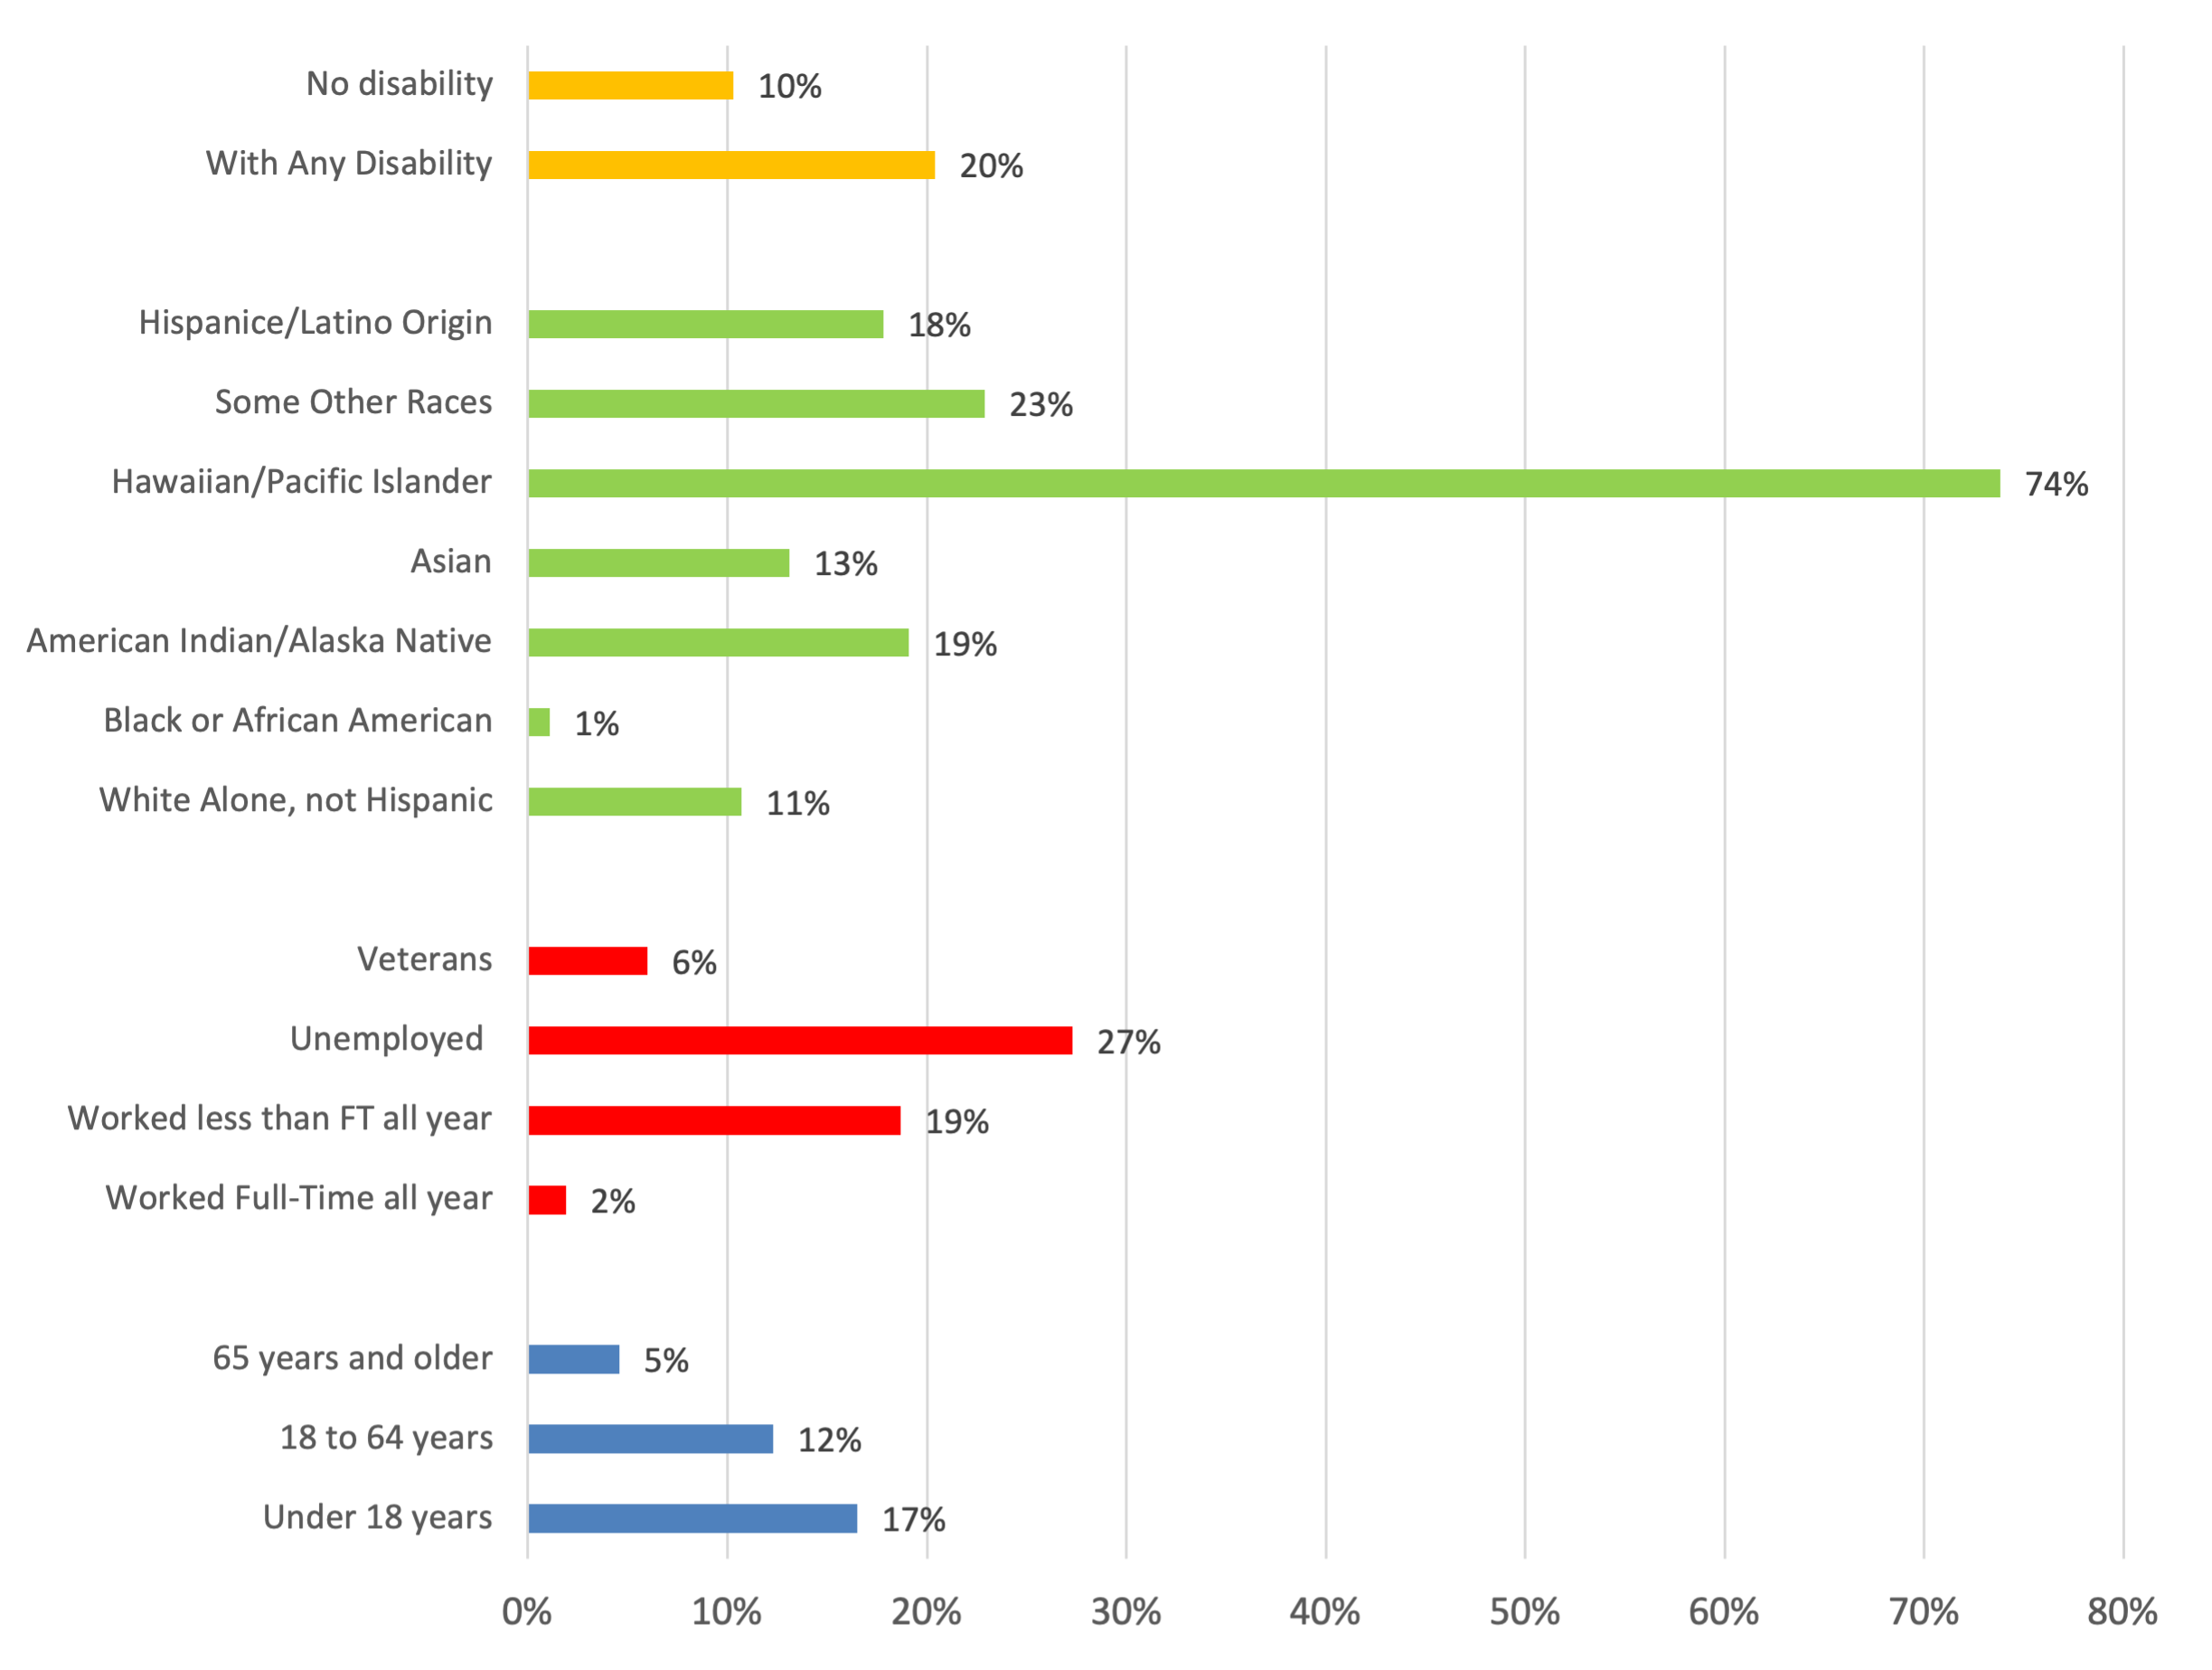
2019 5-yr American Community Survey Data, US Census Tables S1701, S1703, and C21007
Employment Status and Income by Disability Status
| Total Civilian Noninstitutionalized Population | With a Disability | No Disability | |
|---|---|---|---|
Employment Status |
|||
| Population Age 16 and Over | 42,394 | 8,113 | 34,281 |
| Employed Population Age 16 and Over | 25,430 | 2,286 | 23,144 |
| Employed Percentage | 60.0% | 28.2% | 67.5% |
| Not in Labor Force Percentage | 35.9% | 66.7% | 28.6% |
Wages |
|||
| Population 16 and over with earnings | 28,291 | 2,726 | 25,565 |
| $1 to $4,999 or less | 10.2% | 22.6% | 8.9% |
| $5,000 to $14,999 | 13.6% | 15.4% | 13.4% |
| $15,000 to $24,999 | 15.3% | 14.2% | 15.4% |
| $25,000 to $34,999 | 13.7% | 8.6% | 14.2% |
| $35,000 to $49,999 | 15.6% | 20.5% | 15.1% |
| $50,000 to $74,999 | 17.8% | 12.5% | 18.4% |
| $75,000 or more | 13.9% | 6.2% | 14.7% |
| Median Earnings | $32,810 | $24,212 | $33,540 |
